As ex-underwriters, Concirrus’ product managers shape the direction of innovation within their teams. Their experience of underwriting processes allows them to understand customer requirements and whether they’re being met through new and existing features. Cargo has seen a host of new features since its inception:
- Deductible simulator for ‘as if’ claims performance
- Breakdown of supply chains and trade routes
- Port & vessel exposures and accumulations
- Storage location mapping and accumulation analysis
- Pricing
Whilst these capabilities have been discussed in great depth individually, it’s important to note that they are designed to be used within a workflow. This can be either from submission to policy, or existing policy to renewal. Everyone’s experiences are different and understanding how these capabilities combine to form a full process can sometimes be challenging. Ed Ronayne, Product Manager for Quest Marine Cargo looks back on his time in underwriting, the workflows that existed, and how digitisation can enhance how underwriters perform their role.
Simplified adoption and data entry
Upon receiving a submission, an underwriter would review the quality of information provided, clarify any missing details, and enter it into a policy admin system and/or rating tool. This is often a manual task which is time consuming and often leads to ‘double keying’ or errors. Whilst most submissions are received digitally, and can be catered for using our submissions module, we will assume the adoption of Quest Marine Cargo only. As with any new type of analytics software, the platform typically runs alongside existing systems with an API linking data entry. This eases adoption and allows an organisation to test new software with relatively low risk. Platforms like Quest Marine Cargo are hosted securely in the cloud, so there’s no additional infrastructure to be installed on site.
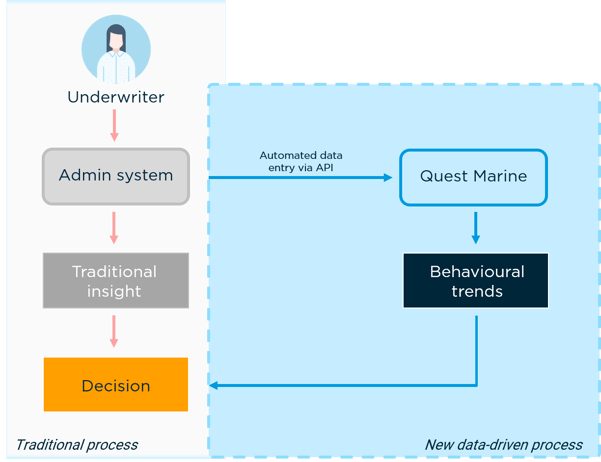
Fig1: An API link between existing and new infrastructure before full adoption
A broader data source for more accurate analytics
When creating a policy or importing your portfolio, you can match accounts to bill of lading data drawn directly from Concirrus’ data lake. This immediately populates Quest Marine Cargo with relevant data and analytics. The data shown can be used to supplement submission information, or prospect potential new clients. For brokers the same data may offer insight into the client’s risk and exposures that can be used to tailor the coverage or loss prevention activities.
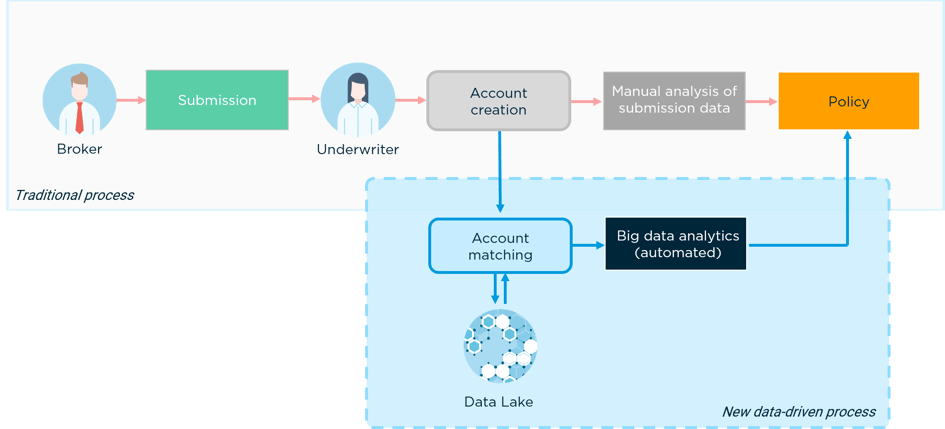
Fig 2: Account matching and automated analytics vs traditional manual analytics
Centralised portfolio analysis
New data-driven processes, like Quest Marine Cargo, show the health of a portfolio can be seen in one page. A simple view of performance over time outlines the drivers of income and claims. This information can directly influence strategy, and how that strategy is executed by the cargo underwriting team. It breaks with the old days of generating and checking reports to ensure accuracy. Any team member can access these figures and investigate portfolio composition and profitability.
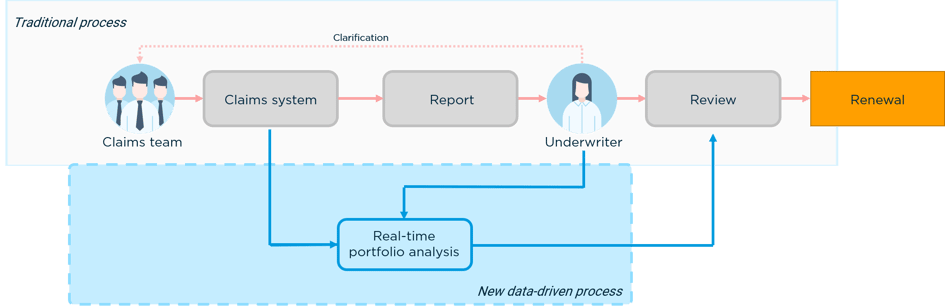
Fig 3: Manual report generation and validation vs real-time portfolio performance
Using the account list, any underwriter can view the details and performance of any bound account. This is more efficient than managing the same records in folders and drives, but also unifies systems that may be disjointed in organisations.
Structure renewals in line with strategy
Account claims data fed into Quest Marine Cargo can be used to simulate different deductible scenarios through deductible matching. Understanding past performance and applying those trends in a simulated environment can help optimise deductibles for specific good types or causes of loss. This helps to identify whether a strategy would suit the account in question, and how it might respond if implemented.
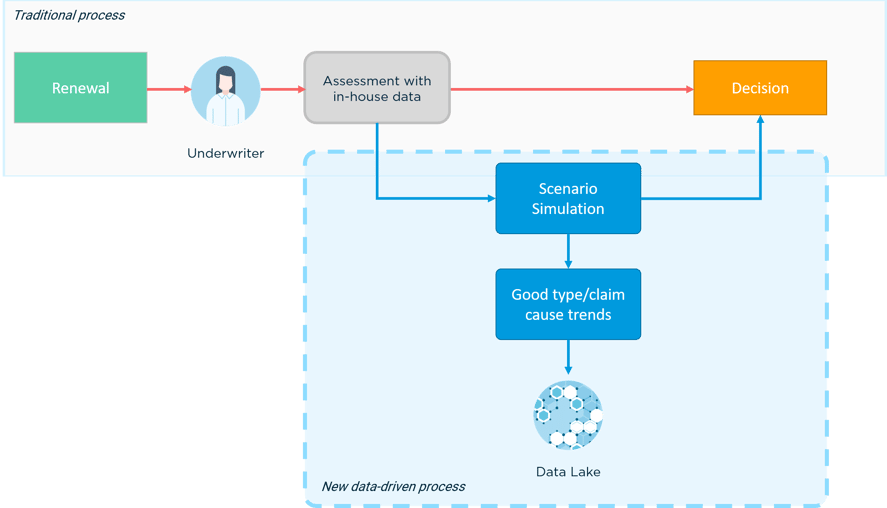
Fig 4: The ability to leverage select trends over time to test hypothesis at renewal
Price based on vast intelligence
Pricing informs both renewals and new business decisions and relies solely on the information provided by the client in the submission. By using a digital platform, data sources drawn from a vast data lake are modelled to score business. This is automated using algorithms as the size of the data considered would take an actuarial team far too long to process. The drivers of risk are clearly displayed for all underwriters to see, informing on the quality of risk presented.
Combining new datasets with an insurers’ proprietary data has led to a new way of looking at risk, one which considers both traditional and non-traditional rating factors. Until now, this simply has not been possible due to the unavailability of relevant data, as well as the tools to make sense of it.
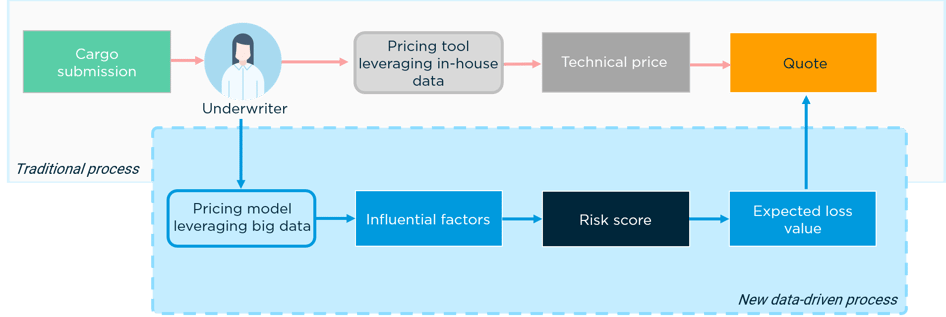
Fig 5: Traditional pricing workflow using in house data vs model using big data
Understand critical events through the live management of your portfolio
Accumulations remain one of the most pressing topics for the Cargo insurance industry. One of a cargo underwriter’s greatest concerns is likely to be the existence of unknown accumulations within their portfolio. Today, most insurers must rely on general assumptions to derive rough estimates for their portfolio exposures simply because the data required to make more accurate assessments has not been available to them.
The first step to tackling the problem is being able to plot an entire portfolio’s storage exposures on an interactive map, which can be searched or filtered to show only the most relevant locations. Nevertheless, in a portfolio of tens of thousands of locations searching for accumulations may be like looking for a needle in a haystack.
In digital platforms like Quest Marine Cargo, individual shipment data displays all cargo’s movements, outlining where it was, when it was there, and associated info like the parties to the shipment. Collating this information shows what the port exposures of any one company were at any given time. Aggregating this port exposure data for multiple companies in a portfolio highlights an insurer’s accumulated exposure. Understanding where significant peaks in exposure occur helps ensure that the appropriate reinsurance cover is in place without significant over-buying. This data can also influence underwriting strategy, adjusting line sizes to reduce peaks in exposure, or influencing decisions such as whether to write the business, percentage of risk, and price.
The same goes for understanding the distribution of risk in storage exposures globally. Visualising storage exposures on an interactive map helps underwriters to understand their portfolio better. Specifically, the analyses of values and distances. This reveals accumulations in any chosen radius, ensuring an underwriters’ attention is drawn to the most pressing areas.
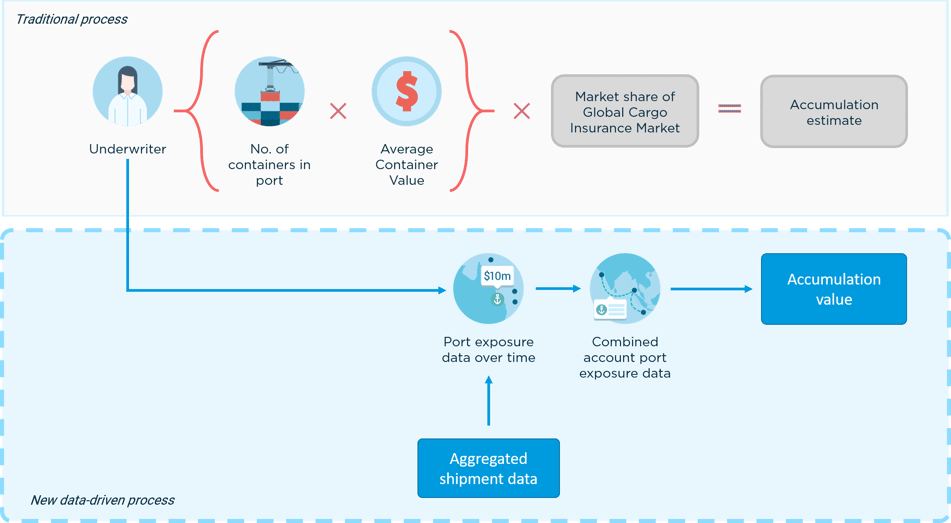
Fig 6: Estimation of accumulations vs value derived from aggregated shipment data
New digital workflows create a more efficient and scalable business. Automation makes manual workflows faster, whilst access to larger datasets improves the accuracy of analysis. As innovation continues, the transition from old workflows to new will become more apparent, until we no longer see digitalisation as ‘new’.
For more detail on Quest Marine Cargo, download the white paper or get in touch: