Digital visualisation of transit and storage exposures is helping the market improve its understanding of portfolio composition, distribution, and risk. In Quest Marine Cargo, port and storage exposures are shown on an interactive map, allowing you to perform a combined assessment alongside the potential impact of large loss events.
A curated data lake underpins all insight. It’s compiled from multiple sources and cleansed to ensure comprehensive coverage and accuracy.
See trends in ever changing environments
Port and storage exposures offer unique challenges. Port exposure is best understood using shipment data to locate goods in port at a moment in time. The frequency of peaks in exposure gives a strong indication on the potential occurrence of a large loss event.
“Our aim was to simplify the understanding of trends in port using new data sources. Seeing the port exposures within a portfolio helps assess the likely impact of a major event at port. This can highlight a need for additional reinsurance to better manage exposures or adjust underwriting strategy to prevent over-exposure to certain events. Detailed understanding leads to informed decisions, meaning underwriters can be more proactive when managing risk.” - Ed Ronayne, Cargo Product Manager at Concirrus.
.png?width=706&name=Port%20Accumulations%20graph%20(full).png)
Fig 1: Graph showing accumulations for top 10 ports over 12 months
.png?width=701&name=Port%20Accumulations%20graph%20(single).png)
Fig 2: Graph showing accumulations for one specific port over 12 months
Isolate value across regions
Storage exposures can be visualised by retrieving coordinates for location addresses. Multiple sites in proximity to each other are grouped into a cluster that separates into separate locations as you focus on that region. Heat maps are used to display the concentration of value within a region vs the number of locations alone. This is particularly effective when there are a significant number of locations in a single portfolio. Zones can be created across any region to monitor changes in accumulation in real-time.
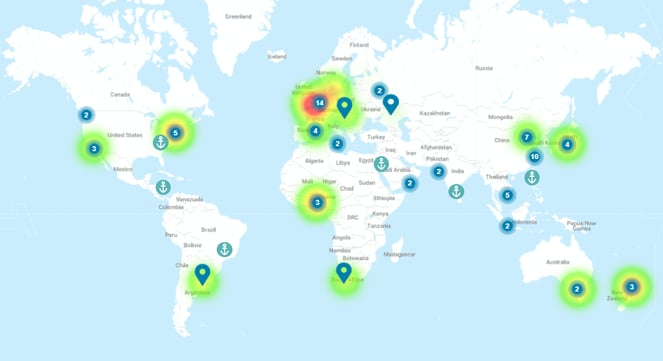
Fig 3: Heatmap including storage location numbers in Quest Marine Cargo
“When you’re working on a large portfolio of storage locations, you want to concentrate on the most significant accumulations first. A heat map is intuitive to understand and shows exactly where the highest concentrations of exposure are. This makes it very quick to find regions of interest, which can then be assessed in more detail using the range of filters available – for example adjusting the stored value filter to remove the lowest value locations, allowing you to focus on those which are likely to have the biggest impact on your portfolio were there to be a major loss event.” - Ed Ronayne, Cargo Product Manager at Concirrus.
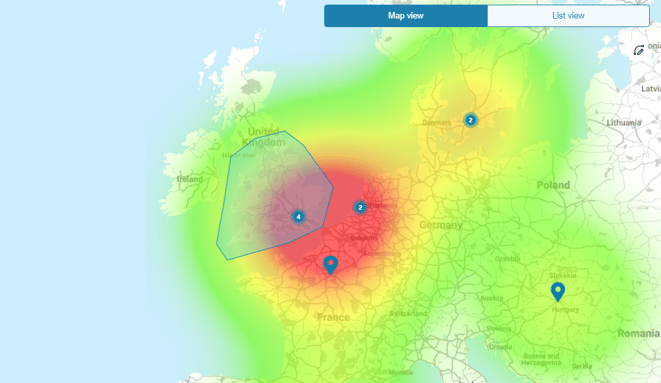
Fig 4: A custom zone monitoring a specific segment of a high value region
Match your approach to the risk type present
Different types of goods present different risk factors. Using storage Statement of Values (SoV’s) along with policy information, we can consider the relationship between the stored values and attachment points for each location. This includes the distribution of storage locations across different value bandings. Displaying this breakdown for large portfolios makes it more efficient for underwriters to see what potential losses may occur in specific types of locations and whether it matches the current strategy.
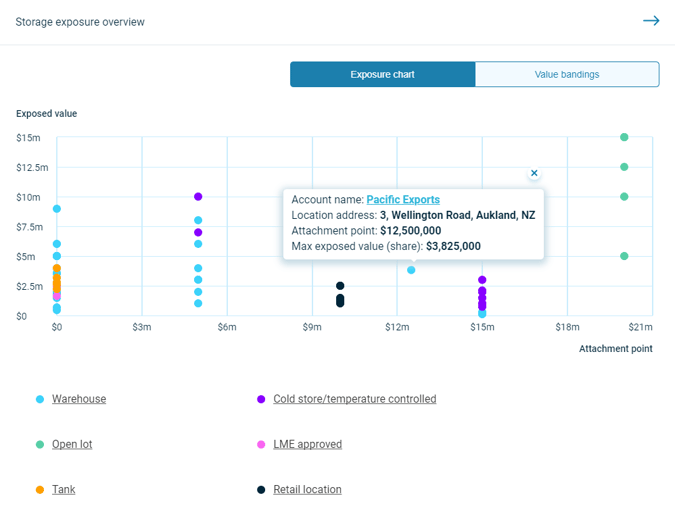
Fig 5: Storage exposure overview in Quest Marine Cargo
“By understanding the values exposed and attachment points for different location types or goods types, an underwriter is better placed to ensure the portfolio aligns with the underwriting appetite and strategy. The underwriter’s appetite for primary storage risks may well be different to excess stock with regard to acceptable line size or type of business, but it is often impossible to have oversight over the entirety of a large and complex portfolio. Quest Marine Cargo allows them to visualise how their storage exposures are distributed based on stored values and attachment points, and segment by location type or goods type as appropriate.” - Ed Ronayne, Cargo Product Manager at Concirrus.
To understand more about how Quest Marine Cargo can help your business, read our white paper or get in touch: