

In part two of our 'COVID-19 - Impact on the shipping industry' blog series we take a deep dive into behaviours observed within the cruise ship sector amid the COVID-19 pandemic and the changing nature of the risk for marine insurance.In our recent blog
‘How does a global pandemic impact shipping behaviour’ we took a macro-level view of the shipping industry to identify changes across key sectors as a result of the COVID-19 pandemic.
One of the worst hit sectors identified within our industry analysis was cruise ships, with many passengers and crew testing positive for coronovirus disease cruising companies have been forced to cancel cruise holidays for the foreseeable future. As a result, the average weekly distance sailed in April of this year down 70.5% compared to 2019. This drastic change is illustrated in Figure 1.
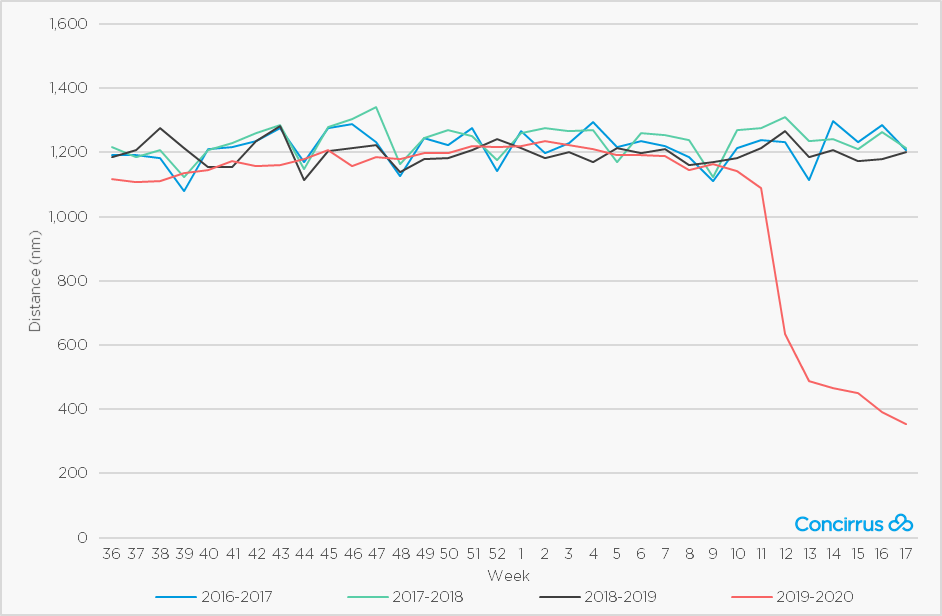 Figure 1. Cruise Ship Average Weekly Distance - Global
On 23 April 2020, Willis Re published a report on COVID-19 and its impact on the Marine & Energy Industry. The report included data from Concirrus on the behaviour of containerships and cruise ships operating in 2020 compared to 2019. The findings sparked a lot of debate within the marine insurance community around its implications. We will now take a deep dive into behaviours observed within the cruise ship sector amid the COVID-19 pandemic and the changing nature of the risk for marine insurance.
The number of unique port visits acts as a good indicator of variation in trading geography for all shipping sectors. It is therefore another core metric we can use to analyse vessel behaviour and associated risk profile. Figure 2 shows the global number of unique port visits for cruise vessels. Average number of weekly unique port visits fell to a low of 0.68 in recent weeks, a 74.1% reduction compared to the same time in 2019.
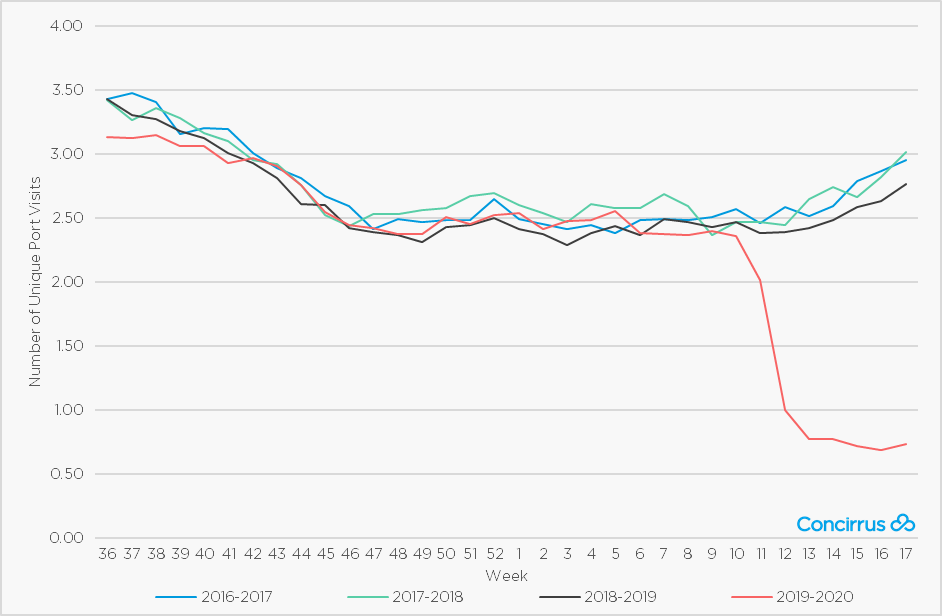 Figure 2. Cruise Ship Average Weekly Unique Port Visits - Global
The drastic reduction in mileage and port visits clearly indicates a material change in operational behaviour and therefore risk profiles in this vessel sector. As many operators review their outgoings as part of cash conservation there is increasing pressure on the insurance market to consider lay-up returns. Some Insurers have agreed to short-term returns; however, the arrival of hurricane season poses additional challenges for the market, particularly around the cost of CAT reinsurance.
If we plot cruise ship locations using AIS data we begin to build up a more granular picture of what has happened, and possible implications in terms of risk exposure.
Examining the cruise industry at times of normal operation, Figure 3 shows the location of cruise vessels around the world on 15 April 2019. Note the spread of vessels throughout the Caribbean, Mediterranean, Northern Europe and the Far East.
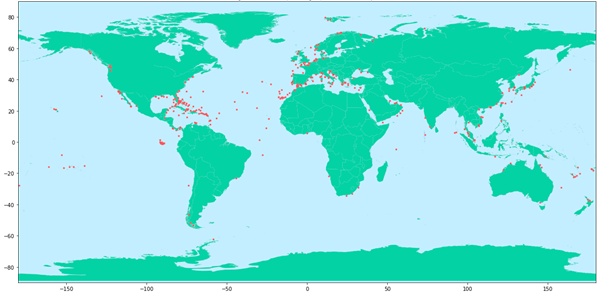 Figure 3. Cruise Ship Locations (Global): 15 April 2019
Examining the same data on 15 April 2020, the map shows a clear reduction in activity and worrying signs of large aggregations of risk in the Caribbean. A trend echoed by TradeWinds in an article focused on the cruise exposure in the Bahamas earlier this week. Figure 4 provides a global view and Figures 5 and 6 provide more detailed views of the Caribbean for the same dates in 2019 and 2020 respectively.
 Figure 4. Cruise Ship Locations (Global): 15 April 2020
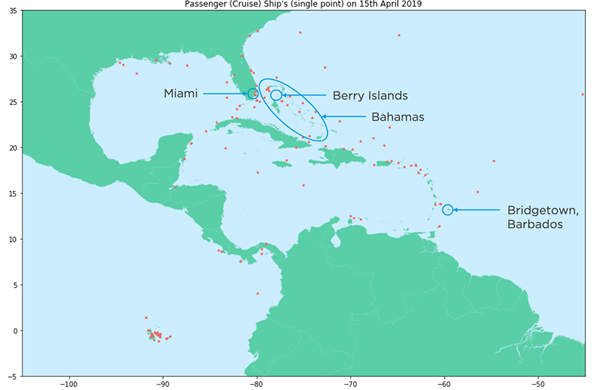 Figure 5. Cruise Ship Locations (Caribbean): 15 April 2019
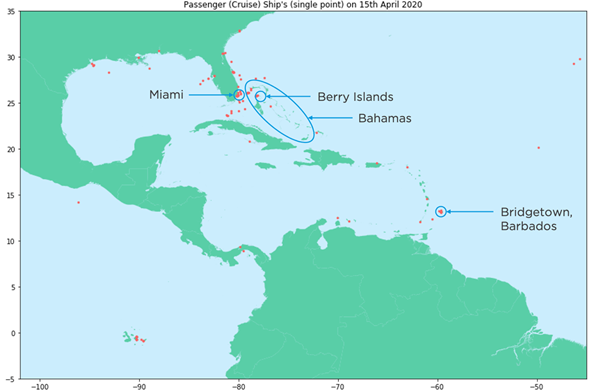 Figure 6. Cruise Ship Locations (Caribbean): 15 April 2020
Figure 6 shows some clear risk aggregations with many vessels clustered in ports and anchorages in Miami, the Bahamas and Barbados.
For the majority of the sector, Hull & Machinery contracts will have been negotiated for the 01 April renewals as lockdown was beginning and the global workforce was adjusting to working remotely. The timing of the renewals may mean that those contracts were agreed without a full knowledge of the emerging aggregation risks the industry is now facing.
One of the most significant risks of interest to insurers as the pandemic continues is the hurricane season. Hurricane season in the Caribbean typically runs from 01 June to 30 November therefore this presents a serious risk for the cruise sector if vessels remain in their current locations. Vessels could be laid-up with limited option to move to alternative ports to seek shelter if a large hurricane were to develop and position itself on a course towards one of these large aggregations.
When considering historical weather data for the aggregation locations we can begin to understand the frequency and severity of these natural catastrophe, or “Nat Cat” events.
In September 2017 the port of Miami was hit by Hurricane Irma. At its peak it was classified as a Category 5 storm and it left a trail of destruction. Peak wind speeds can easily be identified in Figure 7. (N.B. All wind speeds presented in this article are 24-hour interval maximum values measured at 10m elevation, excluding gusts. Localised gust speeds could therefore be notably higher than those presented.)
The industry responded quickly to the storm, anticipating and changing schedules to avoid getting caught in its path. In 2017, most vessels will have had a full crew onboard to deal with the situation, a luxury the industry may not have during the current COVID-19 pandemic as many operate with reduced crew members onboard. On a more positive note, Miami does offer a more sheltered port, and, in the event of a hurricane, vessels should be able to make the necessary adjustments to mooring configurations to keep risk, and potential damage, to a minimum.
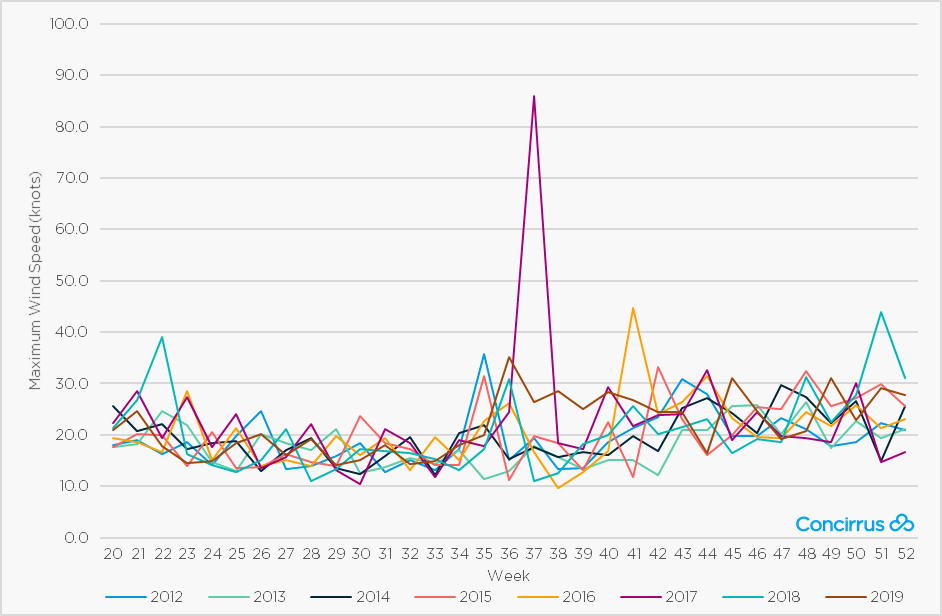 Figure 7. Maximum Weekly Wind Speeds – Miami
N.B. All wind speeds shown are 24-hour interval maximum values measured at 10m elevation, excluding gusts. Localised gust speeds could therefore be notably higher than those presented.
Our data also shows aggregations of cruise ships between Miami and the Bahamas, locations that have been prone to more frequent hurricane activity in recent years.
In October 2016 Hurricane Matthew hit Haiti and Florida causing widespread damage. 24- hour interval wind speeds peaked at 113.8 knots (excluding localised gusts) in the Berry Islands in the Bahamas where we are currently seeing cruise ship aggregations. Historical wind speed data for this location is given in Figure 8. Hurricane Matthew is represented by the significant peak in amber. With numerous vessels currently situated in this region there will be limited capacity in ports where they can seek shelter. Robust hurricane escape plans are therefore becoming increasingly important.
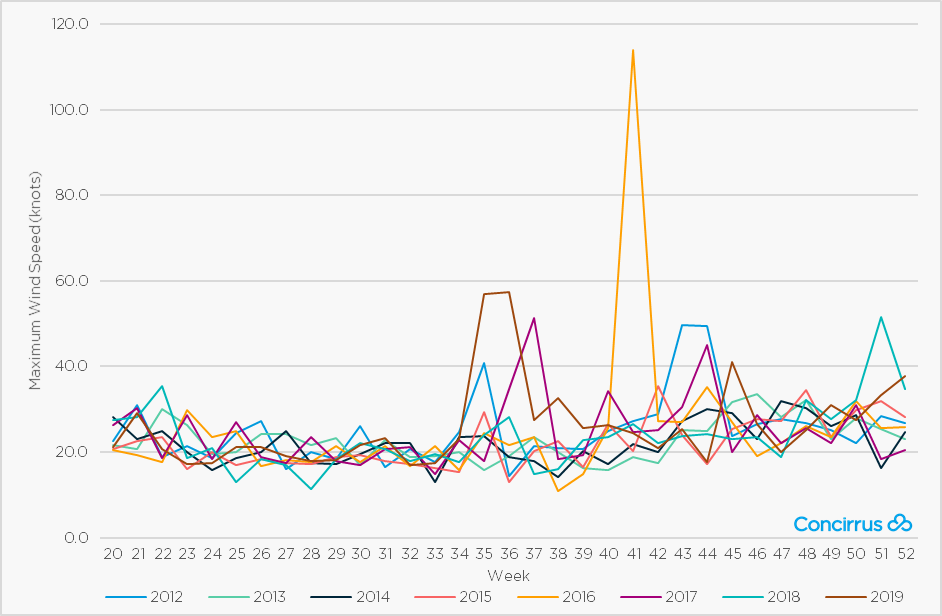 Figure 8. Maximum Weekly Wind Speeds – Berry Islands
N.B. All wind speeds shown are 24-hour interval maximum values measured at 10m elevation, excluding gusts. Localised gust speeds could therefore be notably higher than those presented.
The port of Bridgetown in Barbados, located further south in the Caribbean, has seen a less significant impact from weather events in recent years. Historical wind speeds for the port location are illustrated in Figure 9.
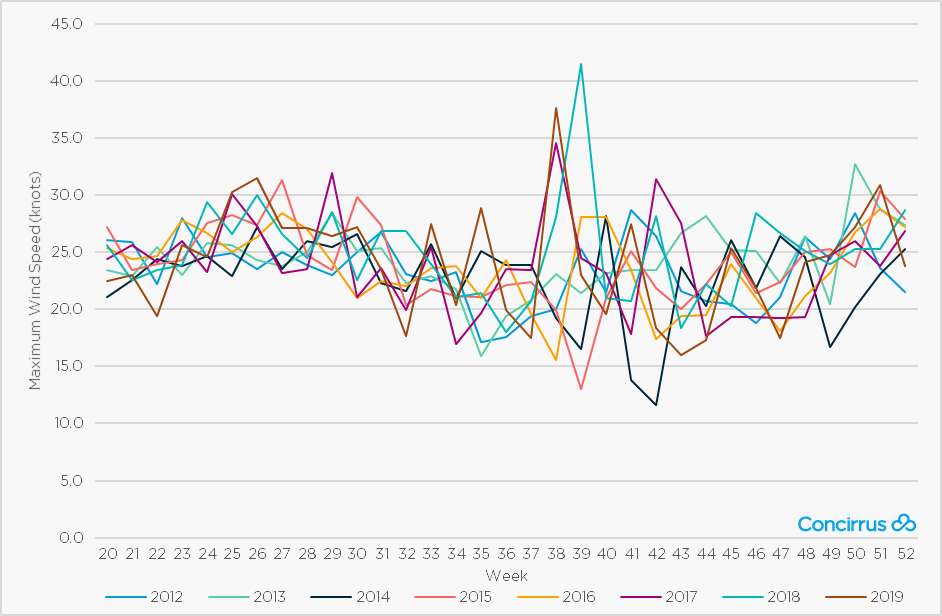 Figure 9. Maximum Weekly Wind Speeds – Bridgetown, Barbados
N.B. All wind speeds shown are 24-hour interval maximum values measured at 10m elevation, excluding gusts. Localised gust speeds could therefore be notably higher than those presented.
As is the case with insurance premiums, we can use historic data as a benchmark for future events. However, when you combine key learnings from historic data with real-time behavioural and environmental data, we can start to make more accurate predictions regarding risk exposure.
Dr Matthias Piot, Meteorologist at Meteomatics, Concirrus’ environmental data provider, outlines their predictions for the 2020 hurricane season in the Caribbean based on their data and expertise.
"Most hurricane modelling groups are currently predicting an above-average season in the Atlantic basin. Forecasting centres expect an average of 8 hurricanes during the upcoming season (against a 10-year average of 7). The main reason behind the higher hurricane activity is the persistent above-average sea surface temperature (between +0.2°C and +1°C) expected by the majority of models in the tropical cyclone development zone and in the Gulf of Mexico in the midst of a neutral-to-weak La Niña signal. However, due to the lack of strong signals, the current forecast uncertainties remain rather high at the time of writing."
Atlantic Sea Surface Temperature (SST) is a good indicator of hurricane activity. Figures 10, 11 and 12 show the deviation in sea surface temperature from the norm for 2005, 2013 and 2020 respectively.
2005 represents a year when there was high hurricane activity and 2013 a year with low activity. In 2005 large areas of the North Atlantic and the Caribbean Sea experienced a warmer SST up to 2°C above normal, and the west coast of Africa over 4°C above normal. In 2013 the SST was generally around the 30-year average in the North Atlantic and the Caribbean Sea. The Gulf of Mexico experienced a cooler SST, up to 3°C lower than normal.
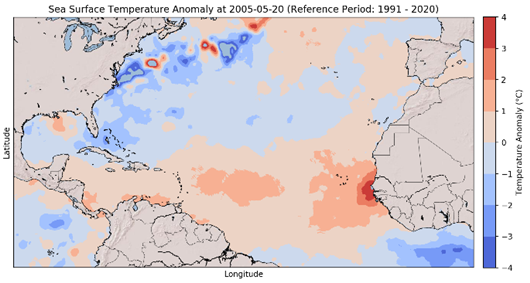 Figure 10. Sea Surface Temperature Anomalies – 2005
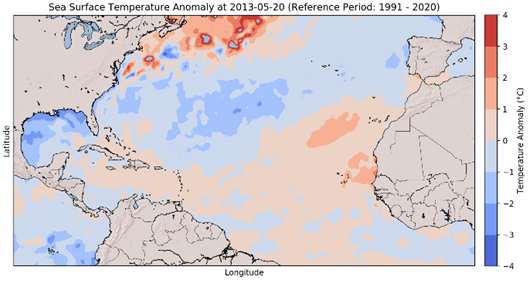 Figure 11. Sea Surface Temperature Anomalies – 2013
The SST for 2020, shown in Figure 12, is showing large areas of warmer waters in the Gulf of Mexico and the Caribbean Sea with deviations of +2-3°C. The North Atlantic is around average, and a warmer area is developing east of the Greater Antilles with a temperature anomaly up to +2°C.
Piot adds that “the current SST is warmer in those regions compared to the mean and therefore an indicator for higher levels of activity in the upcoming hurricane season.”
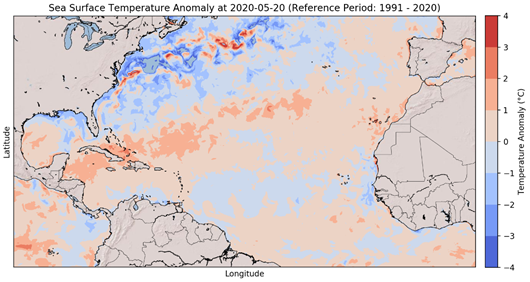 Figure 12. Sea Surface Temperature Anomalies – 2020
The direct result of the anomalous SST for 2020 can be seen in Figure 13 which illustrates the probability of a tropical cyclone in the Caribbean region and US East Coast. These probability estimates, generated by Meteomatics, are determined through wind, precipitation and pressure data from ensemble weather forecasts. At the time of writing, the probability of a tropical cyclone developing between 14 and 24 May 2020 is 50-60% in the Bahamas. This estimate rises to 60-70% 50 nautical miles north of this island chain.
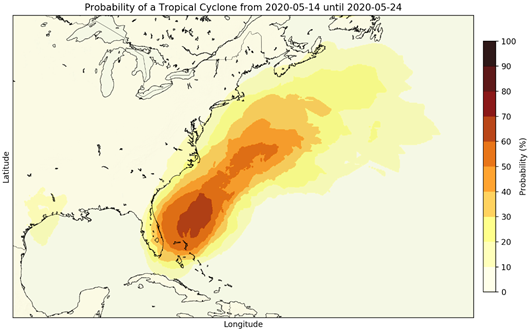 Figure 13. Probability of a Tropical Cyclone from 14 – 24 May 2020.
With travel restrictions still in place and social distancing measures set to remain for quite some time there is uncertainty over when cruise ships might resume normal operations. To avoid adding new levels of risk to the current situation faced by the cruise ship sector, they will need to keep a watchful eye on changing weather conditions in the coming weeks to reduce potential losses.
If you feel that your organisation could benefit from insights such as those in this blog please let us know by completing our Contact form.

