

In the early hours of Tuesday 23 March, news broke that the MV Ever Given, a 400m (1,300ft) container ship had run aground in the Suez Canal, blocking the canal and preventing other vessels from using this vital trade route. Early analysis of the data via Quest Marine provided the traditional static data associated with the vessel plus behavioural and environmental data leading up to the grounding. All this data is critical in assessing the impact of the situation to trade flows and insurance implications.
However, for insurers around the world they will be paying close attention to the situation for the next few days as they monitor vessel aggregations.
Escalating aggregations
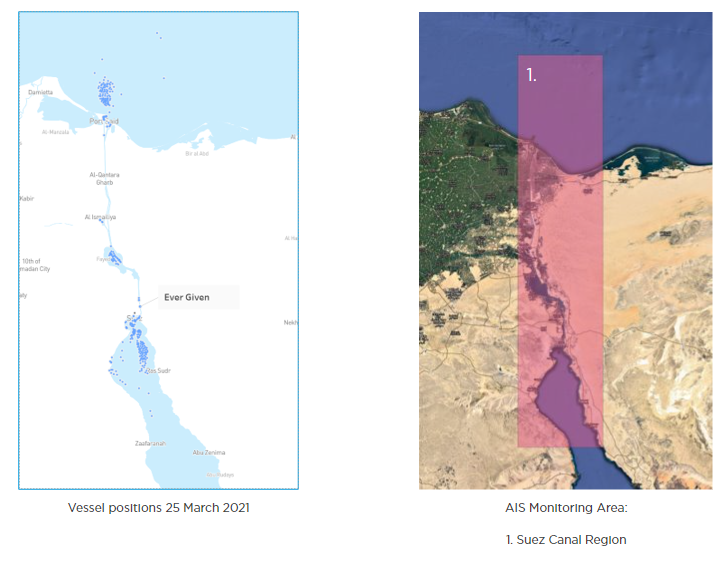
In this blog we’ll look at the changing data from the 25 March, just 2 days after the grounding, to the 30 March, shortly after the MV Ever Given was refloated and the waterway was cleared.
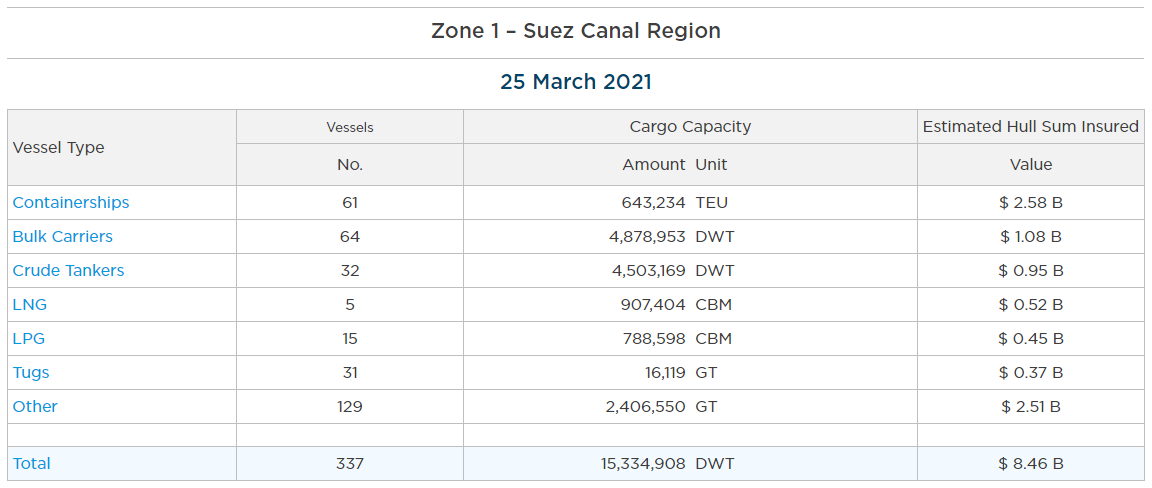
On the 25 March, our data showed the following vessel aggregations around the Suez Canal by vessel type. With aggregations of 337 vessels in the area with a cargo capacity of 15,334,908 Deadweight Tonnage (DWT) and a value of $8.46bn of Hull Sum Insured.
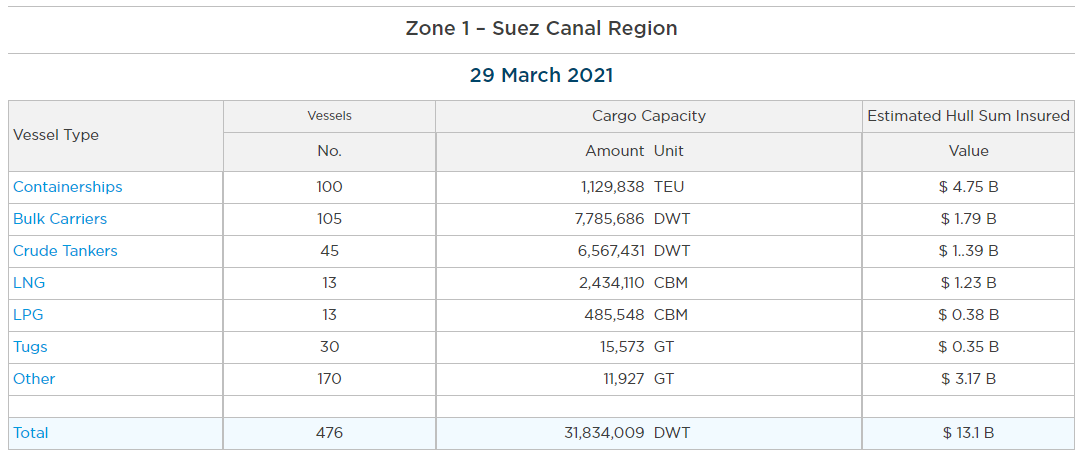
In the days that followed, more vessels began queuing and here you can see the volumes on the 29 March in comparison:
All sum insured values are based on the Concirrus Hull Sum Insured model.
On the 29 March, prior to the refloating of the MV Ever Given, the vessel, cargo and hull sum insured aggregations peaked and the data revealed a 54% increase in hull sum insured values in the region.
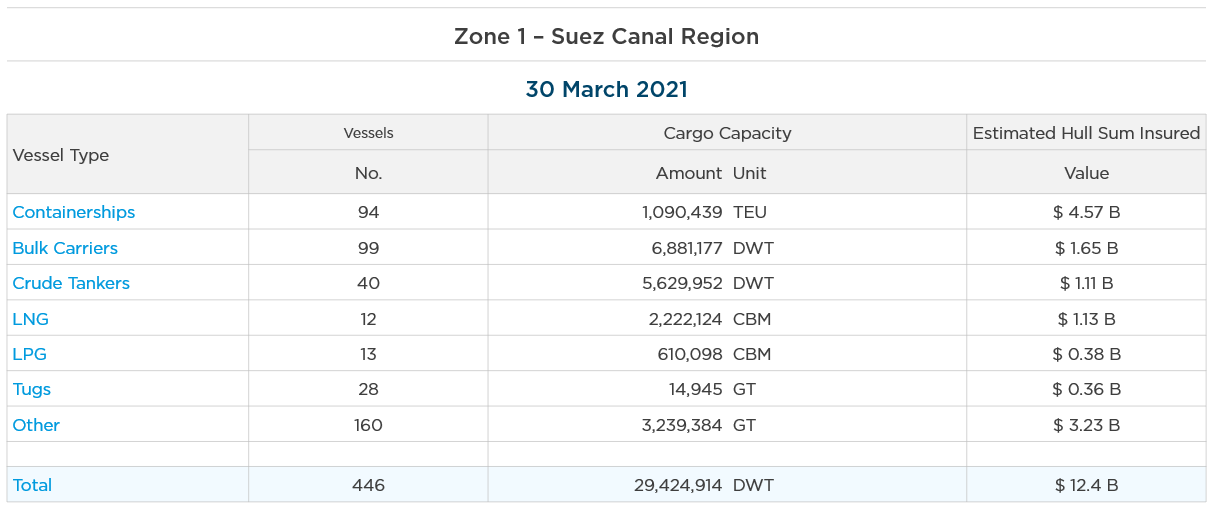
By the 30 March, just hours after the Suez Canal resumed operations, the aggregations had reduced slightly however there were still 447 vessels in the area with a hull sum insured value of $12.4bn.
Whilst the Suez Canal Authority work to clear the backlog there will also be new arrivals joining the queue, so it is expected to take around 3-4 days to resume normal transit volumes.
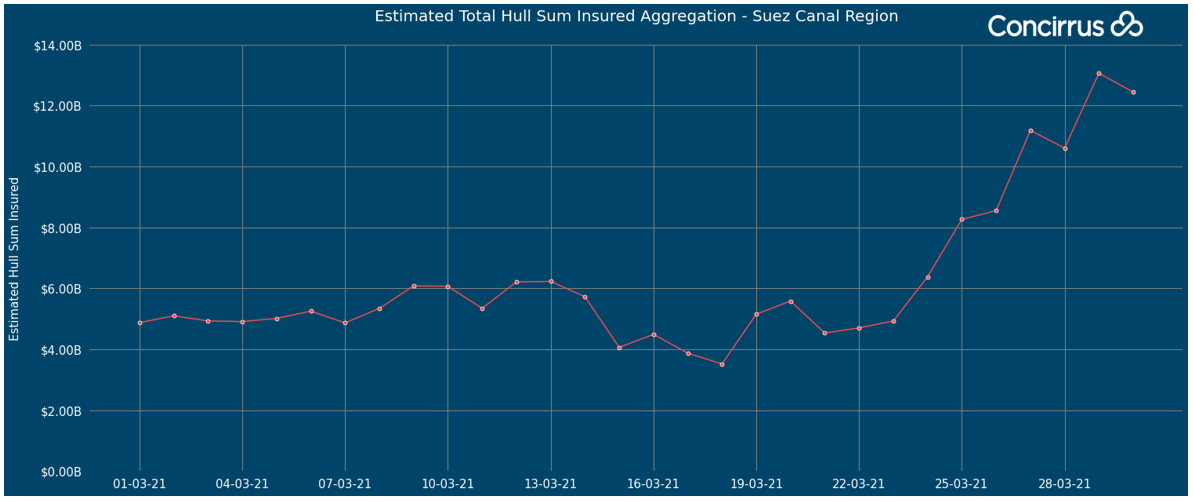
Aggregation trends over time
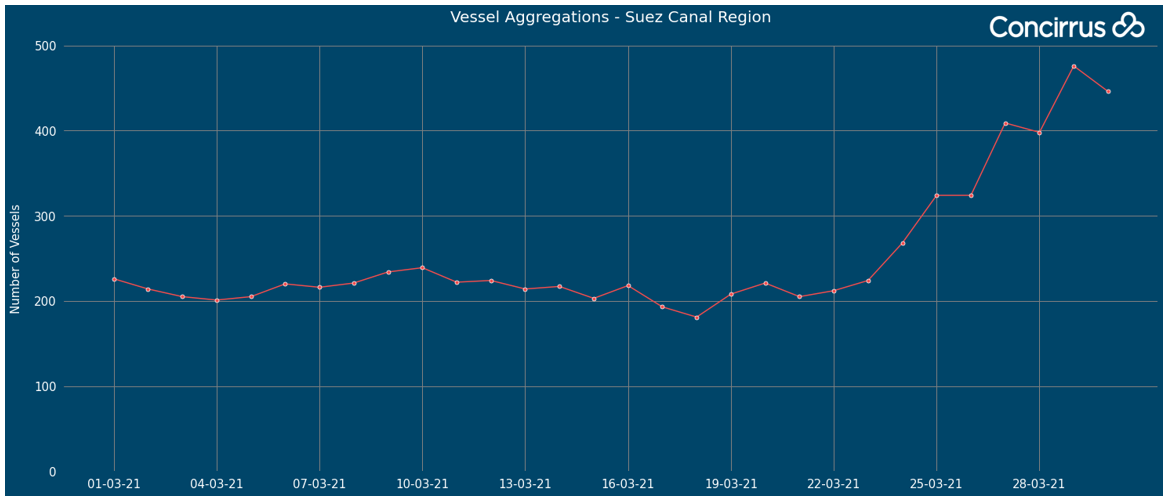
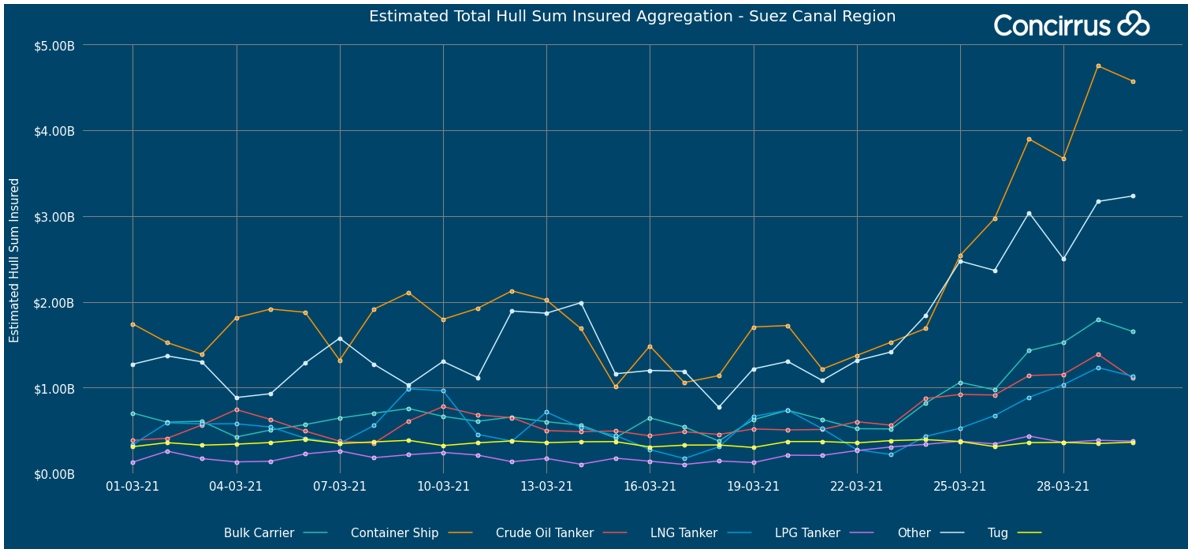
In the following graphs, you can see the change in total vessel aggregations and hull sum insured values over the last two weeks. The aggregations are steady until 23rd March before rising in the days that follow. Yesterday shows a reduction in the vessel numbers and hull sum insured in the area, however there’s still a long way to go before the volumes are back to normal levels.
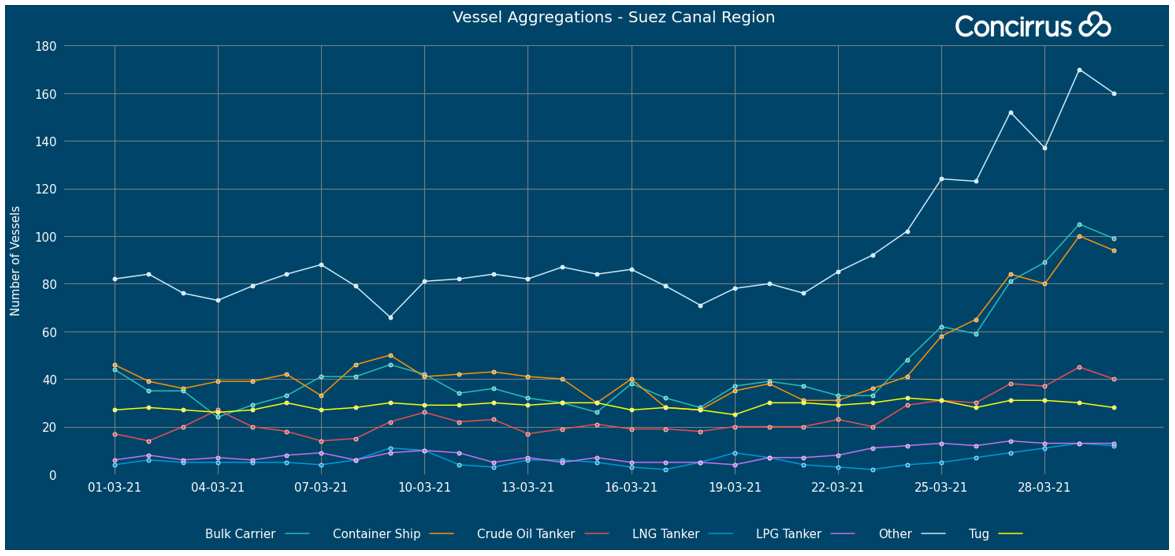
We can also segment the data further to consider the aggregations by vessel type. In the following set of graphs you can see the hull sum insured values and vessel numbers broken down by Bulk Carrier, Container Ship, Crude Oil Tanker, LNG Tanker, LPG Tanker, Tug and Other
Armed with this information, insurance practitioners can better advise their clients on risk management activities whilst the incident is in progress and the backlog is cleared.
At Concirrus we specialize in bringing together data from reputable sources to give our clients the most complete picture of risk. Below are some of the other data we’ve seen over the course of the MV Ever Given incident.
Speed
Whilst the maximum speed vessels are permitted to transit through the Suez Canal is 7.6 to 8.6 knots, Bloomberg reported that the last known speed of the vessel was 13.5 knots, just 12 minutes before the grounding. Our AIS data suggests that the vessel entered the canal at 8.5 knots, and subsequently accelerated to at least 13.7 knots a few minutes prior to grounding. A vessel of this size (20,000 TEU containership, fully laden) travelling at that speed would suggest that it was hard aground and the salvage efforts would be challenging.
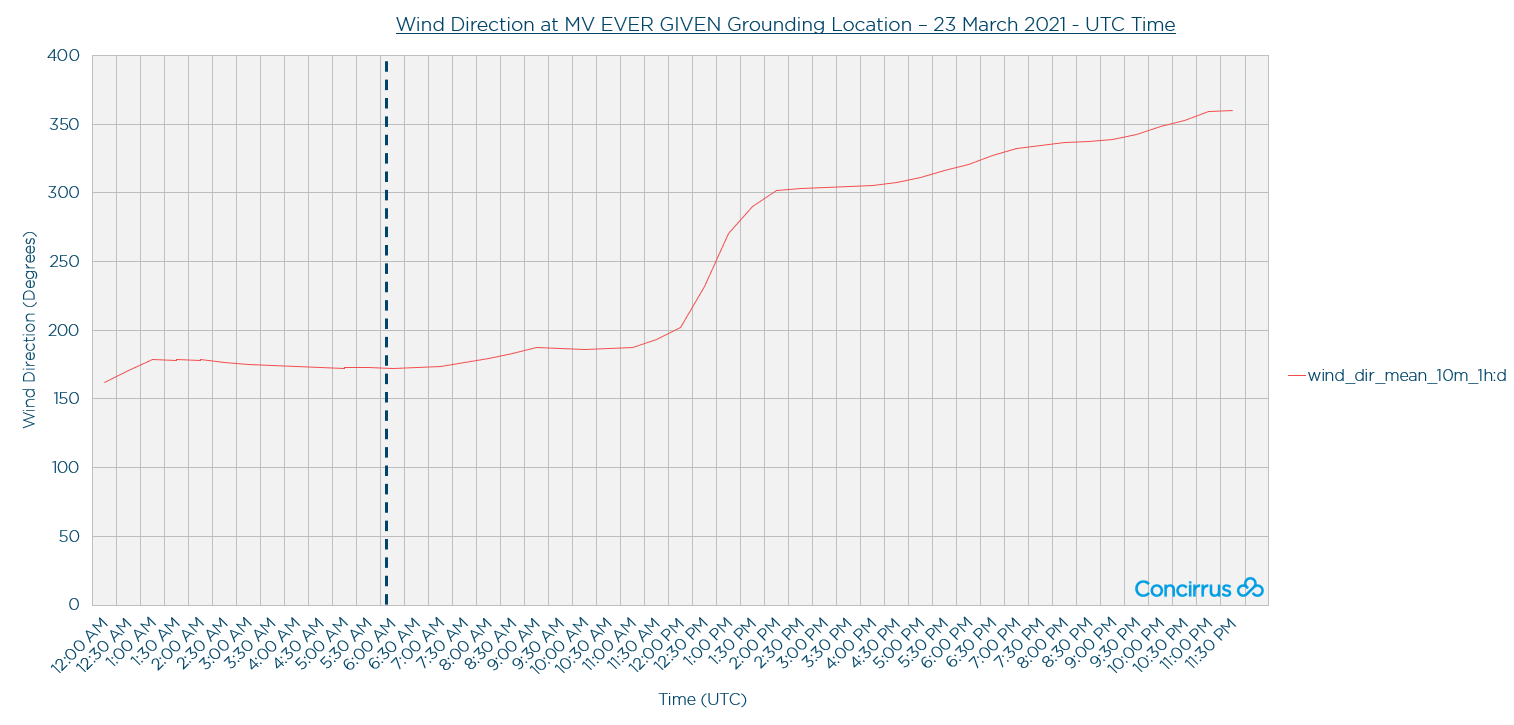
Weather
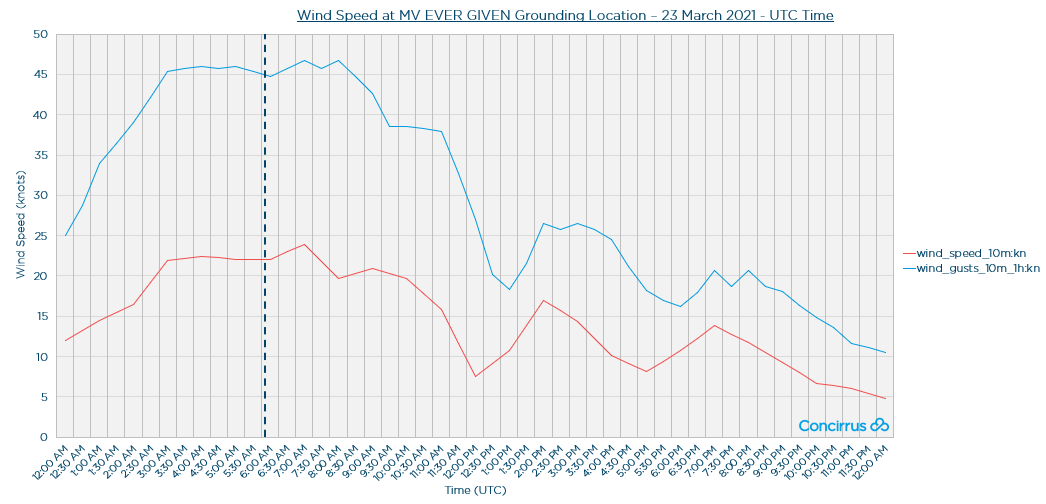
Initial reports indicated that wind speeds were an influencing factor in the grounding event. Our weather data recorded gust wind speeds between 45 and 47 knots, with wind blowing from the south almost in line with the canal and vessel direction, between 03:00 UTC and 08:00 UTC. The grounding event occurred at approximately 07:40 local time, 05:40 UTC, as indicated by the dotted line below.
Sustained high winds could have played a part in the incident. James Whitlam, Data Strategist at Concirrus shared information on a phenomenon called bank effect with TradeWinds last week.
‘…This [bank effect] occurs when a vessel travels down an enclosed waterway and the pressure waves from the hull interact with the bank to cause pressure differentials. This can result in the stern of the vessel swinging towards the bank, therefore, causing deviation from the intended course. Vessel speed is a notable component of the magnitude of this effect.’
First seen in TradeWinds - read the full story here.
Other environmental conditions
At the time of the incident the tide was high meaning that the immediate next high tide would have only marginal impact on refloating efforts, also indicating that the salvage operation could be prolonged. On Monday 29th March, a spring tide was forecast, which was expected to raise the canal’s water level by 18 inches, providing additional buoyancy on the grounded vessel, therefore reducing the ground reaction onto the canal bank. As predicted, these conditions combined with assistance from tugs would be the best chance of moving the vessel quickly.
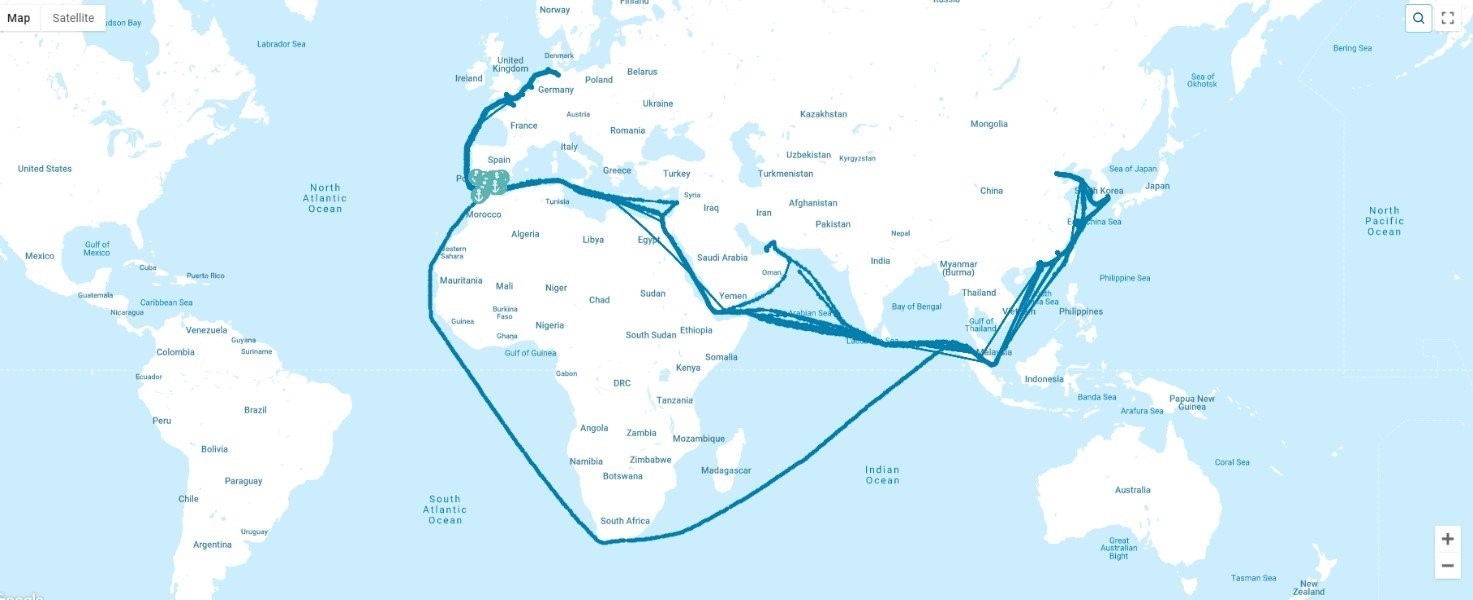
Trade route implications
When the grounding occurred many operators had to make the call to wait and see how long it would take to clear the vessel or divert vessels around the Cape of Good Hope. The last time we saw this route used as an alternative to the Suez Canal was during the height of Covid-19 as market fluctuations caused oil prices, and therefore bunker prices, to drop significantly. The high toll fees of the canal combined with low bunker prices made the long journey more viable for some operators.
To assess the potential disruption to trade, our team considered the average transits through the Suez Canal in 2020 to create a set of baseline metrics. When looking at containership transits, we estimated that a blockage of seven days could have the following delays/diversions for vessel cargo capacity.
- 1,098,363 TEU capacity for containerships
- 7,742,855 DWT capacity for bulk carriers
- 9,448,720 DWT capacity for tankers
Further information on the delays for other vessel types is available. Whilst some operators rerouted, many vessels accumulated around the Suez Canal. As vessel aggregations continue to increase so too does the insurance risk.
For rerouted vessels, the nature of the risk they face changes along with their journey times and the insurance community will be monitoring these vessels closely.
What’s next?
Focus is now firmly on clearing the canal and the backlog of vessels that have been building over the last seven days, which could take time.
Data shows that during 2020, on average there were 51 transits daily through the canal, however in February 2019 on the 150th anniversary of the opening of the canal, the Suez Canal Authority reported its busiest day with 75 vessels transiting the waterway. With more than 440 vessels waiting to pass through the canal, the Suez Canal Authority has estimated 3.5 days to clear the backlog.
Whist the immediate peril is with clearing the backlog of vessels around the Suez Canal, the market is anticipating further aggregations at ports around the world as vessels try to unload their cargoes.
For the insurance industry, access to granular data like this provides many benefits to the market and their clients. Within minutes, practitioners can assess the situation, monitor aggregations, and provide a high level of support to their clients as the situation unfolds.
To find out more about disruption to other vessel types or how the market is using Concirrus data and Quest Marine to manage risk, request a meeting today.

