The potential of a new placement model for cargo insurance, along with profitability optimisation, is being realised. The difference of looking at transit exposure vs more traditional methods offers a new perspective on risk, improving understanding.
Utilising Quest Marine Cargo, we can better understand the overall view of sea-based trade going in and out of the United States for a corporate manufacturer of consumer goods. It gives rise to new levels of exposure which are not typical using typical methods. Variables explored include route, port, country, shipment, commodity, and company exposure.
Country assessment
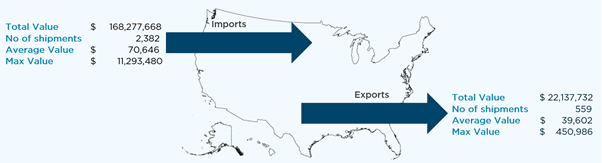
Figure 7: Total US imports and exports of anonymised manufacturer in 2017
Looking at overall imports vs exports, we can see that there is a spike in exposure for imports of $11.3M. This is a large variance and can inform on how to prioritise exposure management within the supply chain. Observing port operations, as well as routes and optimising based on regional variables could lower attritional losses. Methods of transportation as well as operational standards in such areas can contribute to further mitigation.
Sticking with sea-based trade, we can break down total imports into popular routes and the greatest exposures across each one. Mitigation of unique traits per route through targeted risk management will decrease attritional losses.
Imports by route
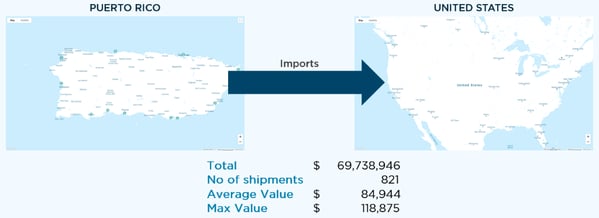
Figure 8: Figures highlighting imports to the US from Puerto Rico
The greatest percentage of total imports to the United States comes from Puerto Rico. We can see that these shipments are typically high volume and low value relative to other routes, posing no immediate concerns. This is not the case for shipments from Argentina, comprising the second largest trade route for the corporate manufacturer. Instead, we see a much higher average value per shipment due to fewer journeys.
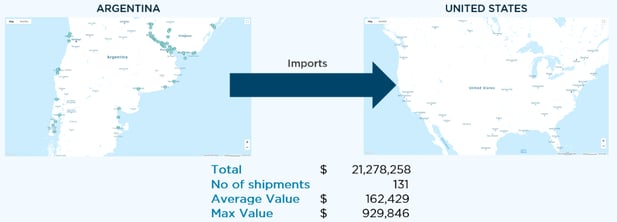
Figure 9: Figures highlighting imports to the United States from Argentina
This trend continues to the third largest trade route, voyaging from Trinidad and Tobago. Whilst a similar percentage of trade is conducted across this route, we have a far higher average value per shipment, over 3.5x greater than the average value seen from Argentina. It is due to the low number of journeys made and presents the greatest exposure seen across all routes, with a maximum value of just over $11 million.
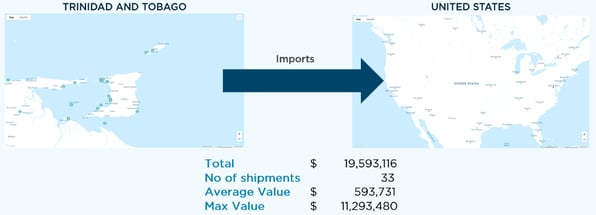
Figure 10: Figures highlighting imports to the United States from Trinidad and Tobago
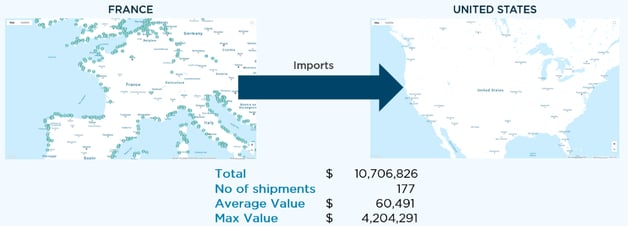
Figure 11: Figures highlighting imports to the United States from France
Whilst the fourth largest trade route by percentage of total trade stems from France, there is a high maximum value. Whilst not as high as that seen via Trinidad and Tobago, it is significant relative to the other routes that comprise of total United States imports.
Port Exposure
After identifying risk based on route, a concentration of exposure can be discovered depending on whether specific ports are used over others. If problems are uncovered within those ports Underwriters can take measures to further manage risk. For example, share of risk can be lowered if accumulation is high. Two routes, stemming from Puerto Rico and Trinidad and Tobago, utilise single ports at each destination. Port exposure for the route from San Juan, Puerto Rico to Jacksonville, United States will therefore reflect the figures shown in the route, with no immediate concerns. The Port Exposure for goods shipped via Pnt Lisas, Trinidad and Tobago to San Juan, United States will however see the same spike in maximum value. The approach to underwriting both ports will therefore be very different.
For more on our approach to Cargo Insurance, read our white paper or get in touch.